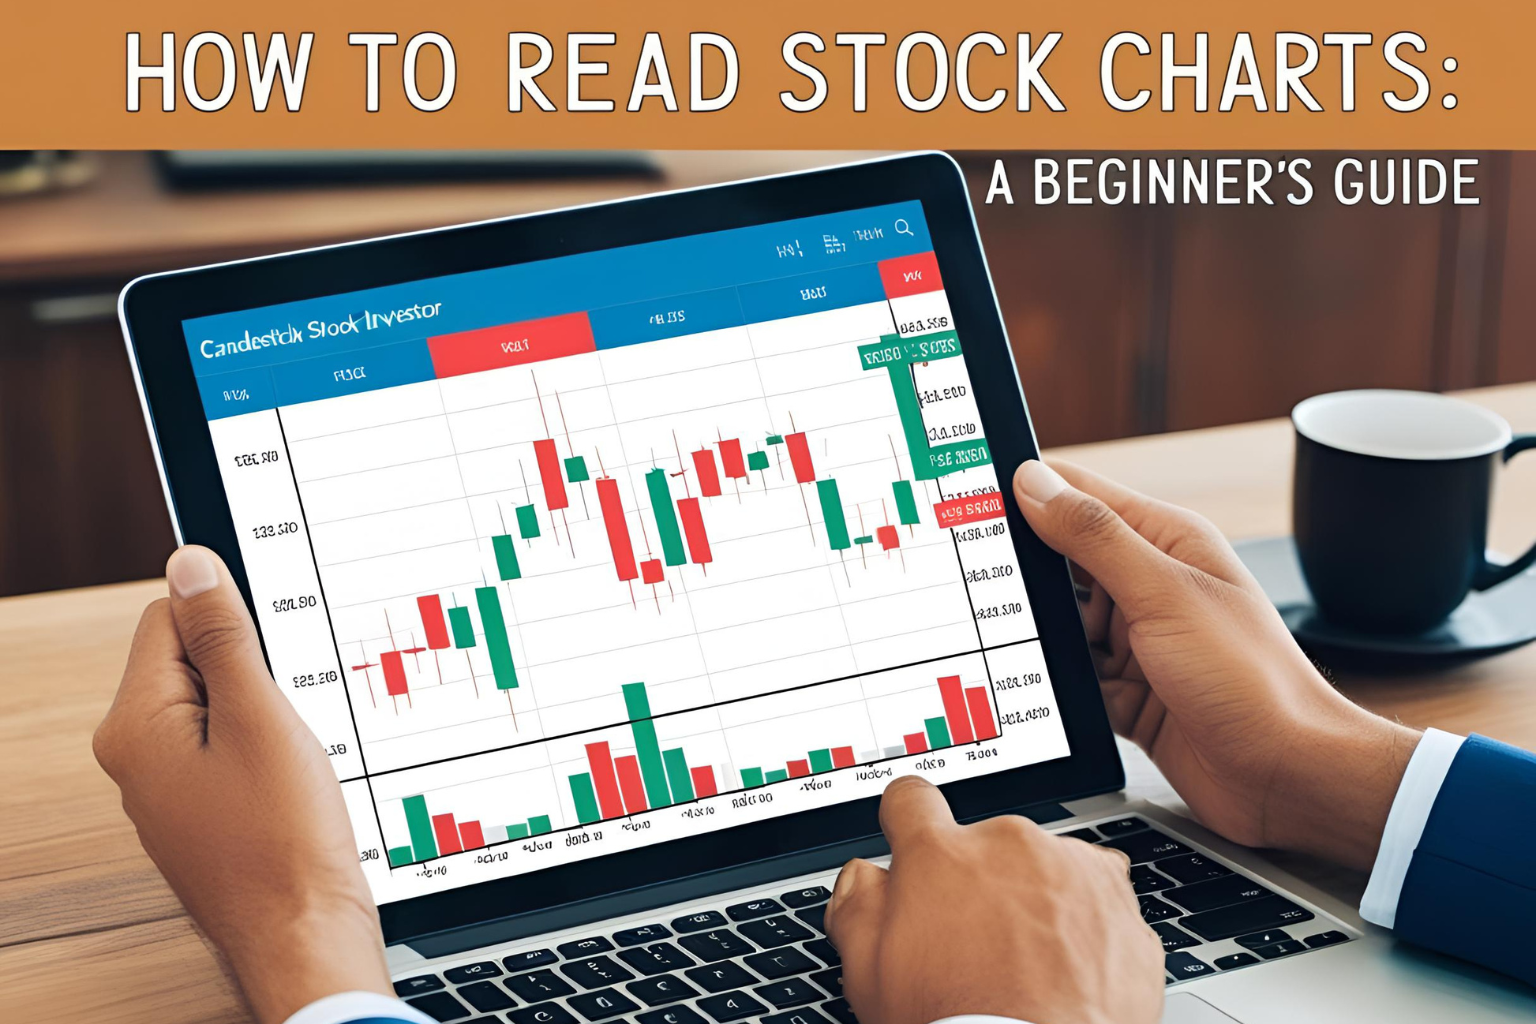
How to Read Stock Charts: A Beginner’s Guide (India Focus)
Understanding how to read stock charts is one of the most valuable skills for any investor or trader in the Indian stock market. Whether you’re evaluating a tip or analyzing a stock on your own, charts help you visualize price movements, spot trends, and time your entries and exits more effectively.
In this beginner’s guide, we’ll explain the key components of stock charts, tools, and tips to help you get started with confidence.
What Is a Stock Chart?
A stock chart is a graphical representation of a stock’s price movement over time. It shows how the price has changed during a specific period—minutes, days, weeks, or months—and helps you identify patterns and trends.
Where to View Indian Stock Charts:
- TradingView (free/paid)
- Moneycontrol
- NSE India or BSE India
- Broker apps like Zerodha Kite, Upstox Pro
Basic Elements of a Stock Chart
1. Price Axis (Y-axis)
Displays the stock price.
2. Time Axis (X-axis)
Shows the time period (daily, weekly, hourly, etc.).
3. Candlesticks or Lines
Candlestick charts are the most used format. Each candlestick shows:
- Open: Price at the start of the time period
- High: Highest price during that time
- Low: Lowest price during that time
- Close: Price at the end of the time period
Green candles mean price went up. Red candles mean price went down.
Step-by-Step: How to Read a Stock Chart
Step 1: Identify the Timeframe
Choose a chart based on your goal:
- Daily/Weekly for long-term investing
- 15-min/Hourly for intraday or swing trading
Step 2: Spot the Trend
Is the stock making higher highs and higher lows (uptrend), or lower highs and lower lows (downtrend)?
Step 3: Use Moving Averages
- 20-day and 50-day moving averages show trend strength
- Price above these lines = bullish sign
- Price below = bearish sign
Step 4: Look at Volume
Volume bars below the chart show how many shares were traded. Higher volume on price rise = strong momentum.
Step 5: Find Support and Resistance
- Support: Price level where stock tends to stop falling
- Resistance: Level where stock tends to stop rising
Example: HDFC Bank Chart (Daily)
- Stock in an uptrend
- Trading above 50-day and 200-day MAs
- Bounced from support at ₹1,450
- Volume rising with price → bullish signal
Tips for Beginners
- Avoid trading based on single candles; look at the overall trend
- Don’t panic on short-term drops; focus on patterns
- Use free tools like TradingView to practice without investing money
- Combine charts with basic news/fundamentals
Common Mistakes to Avoid
- Relying on too many indicators
- Ignoring volume trends
- Trading without identifying support/resistance
- Making decisions on 1–2 candles instead of trend structure
FAQs
Q1: Which chart type is best for beginners?
Candlestick charts are the best as they show more information than line charts.
Q2: How can I learn to read charts faster?
Practice on demo platforms like TradingView and backtest stock patterns.
Q3: Do I need to learn technical analysis to read charts?
Basic technical analysis helps, but even learning trends, support/resistance, and volume is enough to start.
Q4: Are chart patterns reliable for Indian stocks?
Yes. Indian stocks follow global technical principles like any other market.
Q5: Should I use daily or intraday charts?
Use daily for investment and intraday (15-min/1-hr) for short-term trades.