How to Read Stock Charts

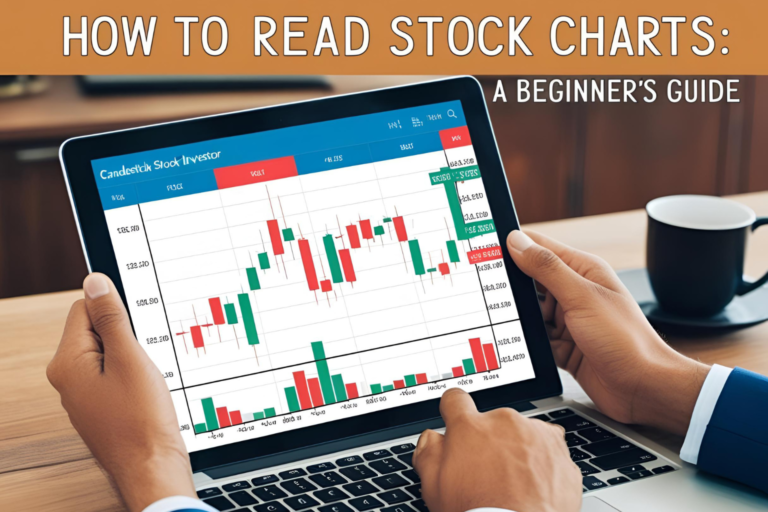
How to Read Stock Charts: A Beginner’s Guide (India Focus)

Understanding how to read stock charts is one of the most valuable skills for any investor or trader in the Indian stock market. Whether you’re evaluating a tip or analyzing a stock on your own, charts help you visualize price movements, spot trends, and time your entries and exits more effectively. In this beginner’s guide,…

Fundamental vs Technical Analysis

Fundamental vs Technical Analysis: Which Should You Use?

If you’re starting your journey in the Indian stock market, one of the biggest questions you’ll face is: Should I use fundamental analysis or technical analysis? While both are powerful methods to evaluate stocks, they serve different purposes and suit different types of investors. This guide compares the two in simple terms to help you…

Understanding P/E Ratio and EPS for Stock Selection

Understanding P/E Ratio and EPS for Stock Selection

If you’re new to the Indian stock market, two terms you’ll hear often are P/E ratio and EPS. These simple financial metrics are powerful tools that help you evaluate whether a stock is overvalued, undervalued, or worth adding to your portfolio. This beginner-friendly guide explains both concepts in plain language—plus how to use them for…

Best Indicators for New Investors in Indian Stocks

Best Indicators for New Investors in Indian Stocks

When you’re just getting started in the Indian stock market, technical indicators can help you make more informed and confident investment decisions. These tools simplify price data and highlight trends, momentum, and entry/exit points. This guide covers beginner-friendly indicators that are widely used by Indian traders and investors—especially those seeking reliable stock tips and analysis….