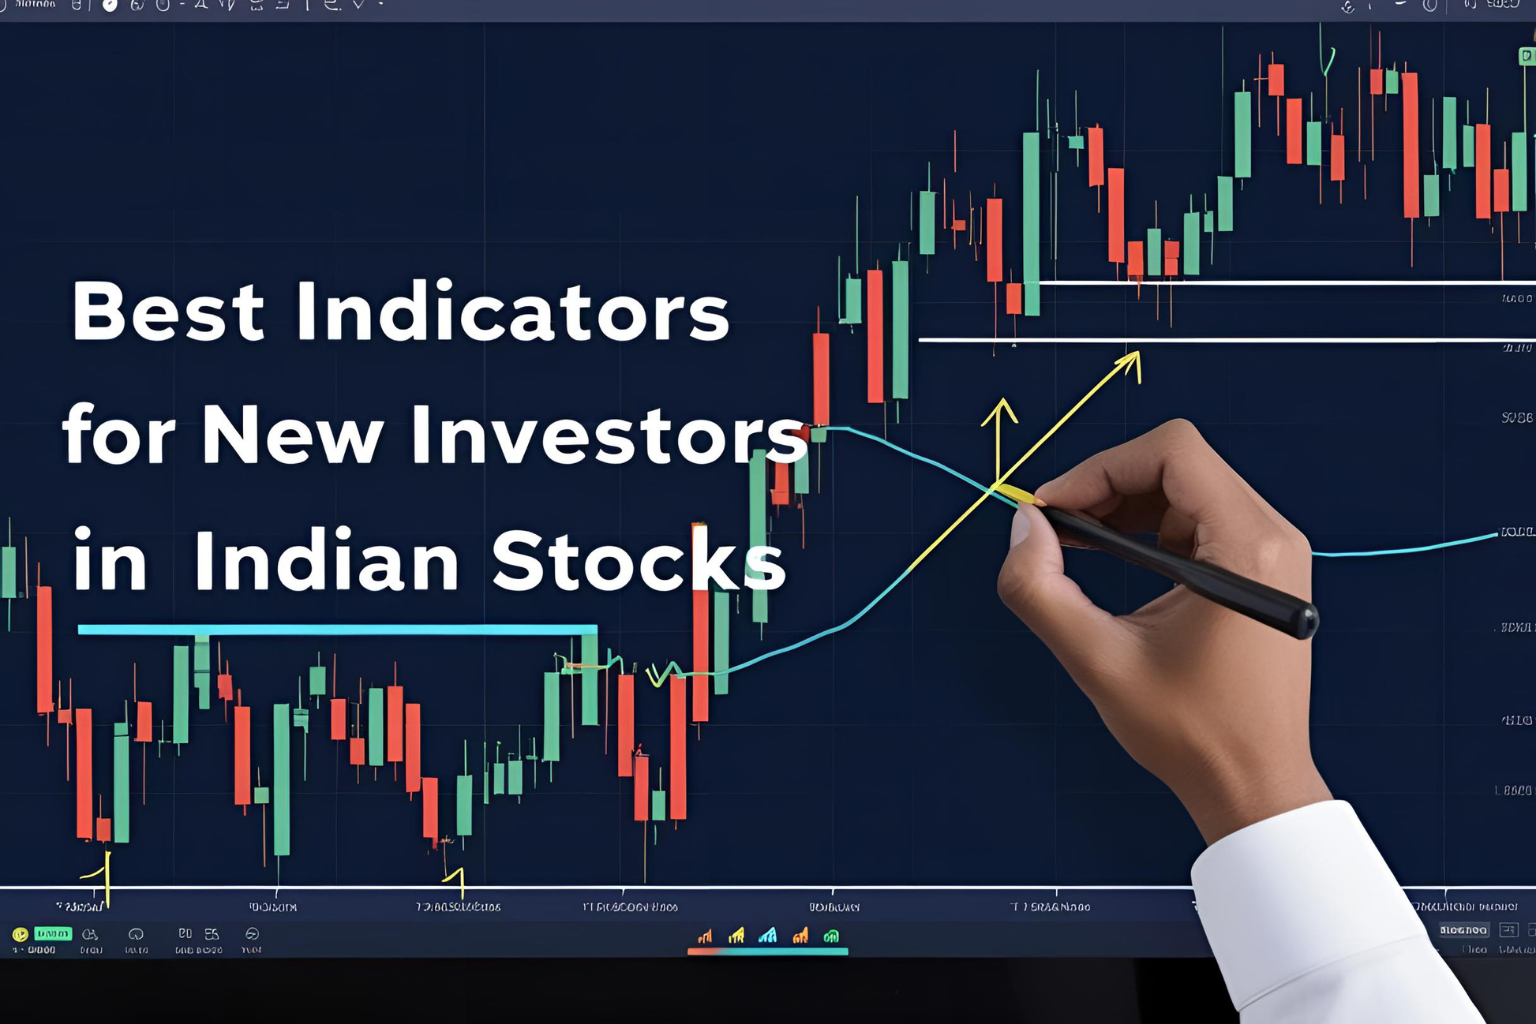
Best Indicators for New Investors in Indian Stocks
When you’re just getting started in the Indian stock market, technical indicators can help you make more informed and confident investment decisions. These tools simplify price data and highlight trends, momentum, and entry/exit points.
This guide covers beginner-friendly indicators that are widely used by Indian traders and investors—especially those seeking reliable stock tips and analysis.
What Are Stock Indicators?
Stock indicators are mathematical calculations based on a stock’s price, volume, or both. They are used to:
- Identify trends
- Spot momentum shifts
- Confirm buy/sell signals
- Reduce emotional decision-making
1. Moving Averages (MA)
Moving averages smooth out price fluctuations to identify the stock’s trend direction.
Common Types:
- 50-Day SMA (Simple Moving Average): For mid-term trend analysis
- 200-Day SMA: For long-term trend confirmation
- 20-Day EMA (Exponential Moving Average): Faster response to recent price action
A stock trading above its 50- and 200-day moving averages is considered bullish.
2. Relative Strength Index (RSI)
RSI measures the strength and speed of a stock’s price movements.
- Range: 0 to 100
- Above 70 = Overbought (potential reversal or pullback)
- Below 30 = Oversold (possible buying opportunity)
Use RSI with support/resistance levels for better signals.
3. MACD (Moving Average Convergence Divergence)
MACD shows momentum and trend direction using two moving averages.
Key Signals:
- MACD Line Crossing Above Signal Line = Bullish
- MACD Line Crossing Below Signal Line = Bearish
Works well with stocks like Infosys, TCS, or HDFC when combined with volume spikes.
4. Volume
Volume indicates how many shares are traded during a time period. It validates price movements.
- High volume on price rise = Strong buying interest
- Low volume on rise/fall = Weak or temporary move
Look for volume breakouts as confirmation of price trends.
5. Support and Resistance Levels
These are horizontal price levels where stocks tend to pause or reverse.
- Support: Price floor
- Resistance: Price ceiling
Beginners can draw simple support/resistance on daily charts for popular stocks like Reliance or SBI.
Bonus: VWAP (Volume Weighted Average Price)
VWAP is used by many Indian traders for intraday and swing trades. It shows the average price based on volume.
- Price above VWAP = Bullish bias
- Price below VWAP = Bearish bias
Commonly used on platforms like Zerodha Kite and Upstox Pro.
Best Platform to Use These Indicators
- TradingView: Free charting with multiple indicators
- Zerodha Kite: Popular among Indian users
- Upstox / Angel One / Groww: Built-in indicators for quick analysis
- Moneycontrol: Quick visual charts and data
Tips for Beginners
- Don’t use too many indicators at once
- Always confirm signals with price action
- Avoid trading based only on indicators—consider news, earnings, and trends
- Start with paper trading to practice applying indicators
FAQs
Q1: Which indicator is easiest for a beginner to use?
The 50-day moving average and RSI are great starting points.
Q2: Can I rely only on indicators for stock selection?
No. Use them alongside basic fundamental checks and news analysis.
Q3: Are these indicators free to use in India?
Yes. Most are available for free on platforms like TradingView, Moneycontrol, and broker apps.
Q4: Should I use the same indicators for every stock?
Start with a base set (like MA + RSI), but adapt based on stock volatility and timeframe.
Q5: Do these indicators work for long-term investing too?
Yes, especially moving averages and support/resistance. They help confirm entry points for long-term positions.