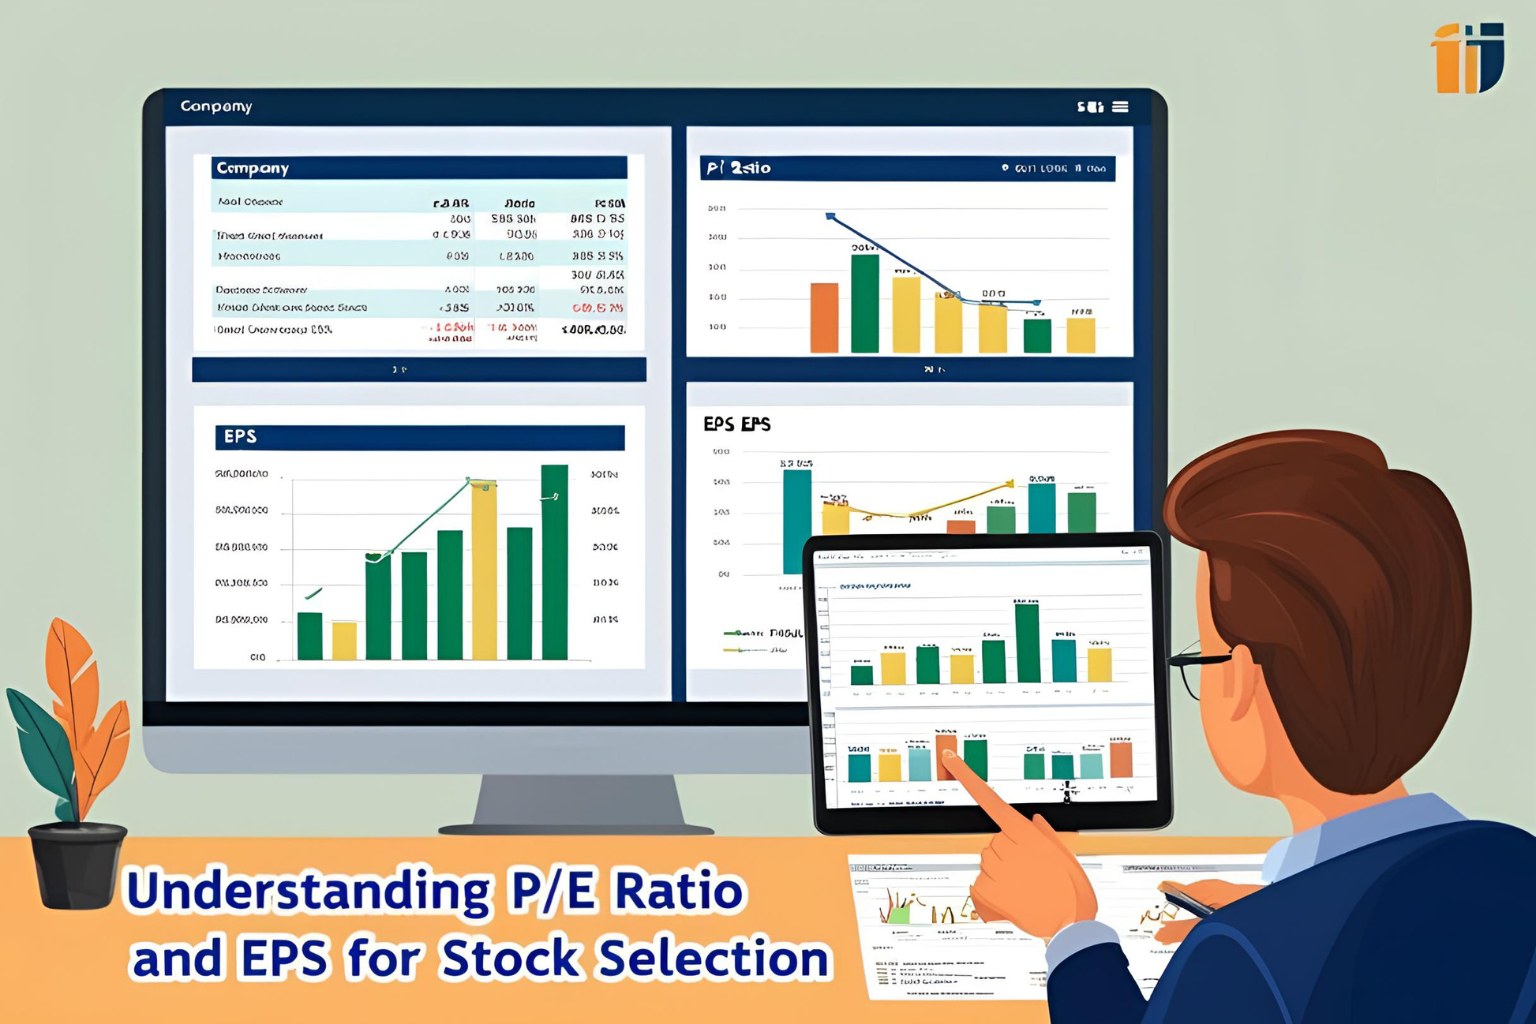
Understanding P/E Ratio and EPS for Stock Selection
If you’re new to the Indian stock market, two terms you’ll hear often are P/E ratio and EPS. These simple financial metrics are powerful tools that help you evaluate whether a stock is overvalued, undervalued, or worth adding to your portfolio.
This beginner-friendly guide explains both concepts in plain language—plus how to use them for smarter stock selection in India.
What Is EPS (Earnings Per Share)?
EPS stands for Earnings Per Share. It shows how much profit a company makes for each share outstanding.
EPS Formula:
EPS = Net Profit / Number of Outstanding Shares
Example:
If a company has a net profit of ₹1,00,00,000 and 10,00,000 shares,
EPS = ₹10
Why EPS Matters:
- Higher EPS generally means better profitability
- Used to compare companies within the same sector
- A rising EPS year-over-year is a positive sign
What Is P/E Ratio (Price-to-Earnings Ratio)?
The P/E ratio compares a company’s stock price to its earnings per share.
P/E Ratio Formula:
P/E Ratio = Share Price / EPS
Example:
If a company’s share price is ₹200 and EPS is ₹10,
P/E Ratio = 200 ÷ 10 = 20
This means investors are willing to pay ₹20 for every ₹1 of earnings.
How to Use EPS and P/E for Stock Selection
1. Compare with Industry Average
A stock with a P/E ratio higher than the industry average may be overvalued.
A lower P/E can suggest a bargain—but check if the low valuation is justified.
2. Look for EPS Growth
A stock with steadily growing EPS is usually a sign of strong fundamentals. Compare current EPS with previous quarters or years.
3. Use for Peer Comparison
Example:
- Company A P/E: 18, EPS: ₹15
- Company B P/E: 28, EPS: ₹10
Company A is cheaper and more profitable per share.
Good P/E Ratio: How Much Is Too Much?
- A P/E between 15 and 25 is considered reasonable for many Indian large-cap stocks
- High-growth companies (like tech or FMCG) may justify higher P/E
- Very high P/E (>50) can signal overvaluation unless strong future growth is expected
When Not to Rely on P/E or EPS Alone
- EPS can be manipulated by accounting changes
- P/E doesn’t reflect debt or cash position
- Don’t compare P/E across unrelated sectors (e.g., banking vs IT)
Always combine these with other indicators like ROE, debt-to-equity ratio, and qualitative analysis (management, market share, etc.).
Indian Examples
| Company | EPS (₹) | Price (₹) | P/E Ratio |
|---|---|---|---|
| Infosys | 58 | 1,450 | ~25 |
| HDFC Bank | 78 | 1,520 | ~19 |
| Zomato (2024) | Negative | 120 | NA |
Zomato has no P/E ratio as it’s not profitable yet.
Where to Find EPS and P/E in India
- Screener.in
- Moneycontrol
- NSE & BSE official websites
- Broker platforms like Zerodha, Upstox, Angel One
FAQs
Q1: Is a low P/E always good?
Not always. It could mean the market expects poor future performance.
Q2: Can I rely on EPS to choose stocks?
EPS is useful but should be combined with other metrics like revenue growth, ROE, and debt levels.
Q3: What is a good EPS growth rate?
Consistent 10–20% annual EPS growth is generally strong.
Q4: Why does a company with losses have no P/E?
Because P/E is calculated using EPS. If EPS is negative, P/E is not applicable.
Q5: Should beginners focus more on P/E or EPS?
Start with EPS to understand profitability, then use P/E to compare valuation.